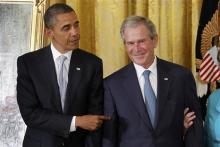
President Barack Obama and former President George W. Bush (AP Photo)
(CNSNews.com) – According to data published by the White House Office of Management and Budget and the U.S. Treasury, federal revenues hit an all-time high of approximately $2.57 trillion—back in fiscal 2007 under President George W. Bush.
Earlier this year, OMB published a table as part of President Barack Obama’s 2013 budget proposal that showed historical federal revenues from 1789 through 2011. On Friday, the U.S. Treasury published the Monthly Treasury Statement for September showing the total federal revenue for fiscal 2012.
In fiscal 2007, according to the data from OMB and Treasury, federal revenues hit an all-time high in both current and inflation-adjusted dollars.
From 1789 through 1849, according to OMB, cumulative federal revenues in non-inflation-adjusted dollars were only $1.16 billion. From 1850 to 1900, they were $14.46 billion. Annual federal revenue first hit the $1-trillion mark in current dollars in 1990. It peaked at $2.567985 trillion in current dollars in fiscal 2007.
In fiscal 2008, federal revenues dropped to 2.523991 trillion in current dollars. In fiscal 2009, they dropped again to $2.104989 trillion. In fiscal 2010, they rose slightly to $2.162724 trillion. In fiscal 2011, they hit $2.303466. And, in fiscal 2012, according to the Treasury, they were $2.449093.
In no year after fiscal 2007, did federal revenues again exceed $2.5 trillion.
Fiscal 2007 retains the record for highest-ever annual federal revenues even when the totals are adjusted for inflation.
The OMB also published a table listing total annual federal receipts in each year since 1940 in constant 2005 dollars. On this inflation-adjusted table, the total federal receipts for fiscal 2007 ranked No. 1 at $2.4131 trillion in 2005 dollars. The No. 2 year for total federal receipts in constant 2005 dollars was fiscal 2006, when they hit $2.3246 trillion.
The $2.449093 trillion in total federal receipts that Treasury has reported for fiscal 2012 equals $2.076178 trillion in constant 2005 dollars–significantly less than the record $2.4131 trillion in constant 2005 dollars in fiscal 2007.
In fiscal 2012, under Obama, both individuals and corporations paid less in cumulative taxes than they did in fiscal 2007 under Bush. In fiscal 2007, individuals paid a cumulative $1.163472 trillion in individual income taxes, according to the Treasury. In fiscal 2012, they paid $1.132206 trillion. In fiscal 2007, corporations paid a cumulative $370.243 billion in income taxes, according to the Treasury. In fiscal 2012, corporations paid $242.289 billion.
Total federal revenues were also higher in 2007 than in 2012 when measured as a percentage of GDP. In 2007, they were 18.5 percent of GDP, according to OMB. In 2012, OMB estimates they will be 15.8 percent.
When measured as a percentage of GDP (as opposed to inflation-adjusted dollars), total federal revenues did not hit their all-time high in fiscal 2007. OMB has calculated total revenue as a percentage of GDP back to 1930. Since then, there have been only three years when it has exceeded 20 percent. Those were 1945, when it hit 20.4 percent; 2000, when it hit 20.6 percent; and 1944, when it hit 20.9 percent.
In no year since 1930 have federal revenues exceeded 21 percent of GDP.
According to OMB’s estimate, federal spending was 24.3 percent of GDP in fiscal 2012–the fourth straight year in which federal spending has exceeded 24 percent.
To balance the budget with spending at 24 percent of GDP, the federal government would need to tax away a higher percentage of GDP than at any time over the past 82 years, as calculated by the Obama White House.
Source material can be found at this site.


